Anyone who goes to college, whether majoring in finance or economics, has heard a problem about portfolio optimization. First, calculate statistical parameters such as mean, variance, correlation, then calculate in excel to run a portfolio including 2 risky assets and 1 risk-free rate asset. However, when applied in practice, things become much more difficult when the portfolio has more than 2 assets (10 or 100 or 1000). If you ask any bachelor or master student about finance, they will probably talk a lot about capital market line, security market line or CAPM. However, to recode the methodology from the papers as well as perform an optimization manually, many people probably give up. And finally, whether this so-called modern portoflio theory is right or wrong in reality, no one can answer accurately. Just looking at the number of citations of Markowitz’s paper (about 20k), if you only pay attention to the critical review part, there are many things to pay attention to if you want to bring modern portfolio theory from theory to asset allocation in practice. This problem arose while I was studying the portfolio management section of CFA, especially after attending a lecture by an asset allocator of an investment fund in Singapore. There are a lot of good people in the market, one way or another, however, I personally prefer portfolio managers who have a scientific, quantitative approach to building a portfolio. For example, when a research analyst gives a number from quantitative such as market share, profit, quarterly margin to qualitative such as crowd behavior, news in the press… the portfolio manager must somehow put the numbers into the model, optimize it to give specific weights for each asset class (stock, bonds, FX…) or more narrowly, securities selection (sectors, value, growth…) that satisfy the minimum investment horizon or liquidity constraints. Furthermore, it is necessary to ensure that the portfolio has a stable return with historical data as well as effective evaluation criteria such as sharpe ratio, treynor ratio, jensen ratio. There are many issues that arise when building such a portfolio, and I will address them in turn in the section below as well as in subsequent articles.

In this blog series, I will use R, Python or Matlab to recode some findings of the key papers. R packages also have many built-in functions, however I will take a deeper look into the source code as well as compare the differences in results between the functions. Note that since R and Python are open source, they are easier to cross-check than Matlab. I will use both English and Vietnamese because explaining keywords in English is much easier!!!
First is an overview of Modern Portfolio Theory (MPT). This comes from the work of a guy named Harry Markowitz. In 1952, at the age of 25, he wrote a scientific research article called “Portfolio Selection” in the Journal of Finance and laid the first foundation for the above theory. Markowitz’s Portfolio Theory explains how to choose a portfolio based on three parameters: Mean, Variance, and Covariance of the returns of individual assets. In theory, portfolio managers or asset-allocators will use the above model to calculate and determine the allocation of capital into different types of assets.
The earliest framework of MPT was called Mean-Variance Analysis. The expected return of the portfolio will be calculated along with the corresponding risk as variance/standard deviation and the correlation between assets as covariance (correlation). Also from here the concept of portfolio diversification is defined. The above conceptual definitions can be easily found via google or textbooks. MVA is based on a number of assumptions, the most important of which is that investors will make investment decisions based on only two portfolio parameters: risk and return. Here risk is understood as standard deviation or variance, a measure of so-called uncertainty while return can be arithmetic return or geometric return depending on how people define it. The choice of standard deviation/variance as the unit of measurement for risk has also created endless debates among academics as well as practitioners. The important reason is that when the uncertainty is related to the increase in the price of a stock, people do not care, because the more increase the better. People only care about whether the stock price has decreased by much and whether the decrease is continuous. Standard deviation or variance calculates both the increase and decrease of price, so many times when stock prices increase steadily and beautifully, they also fall into the category of high uncertainty. Especially when many markets do not allow short-sale or very limited short-sale on low liquidity stocks.
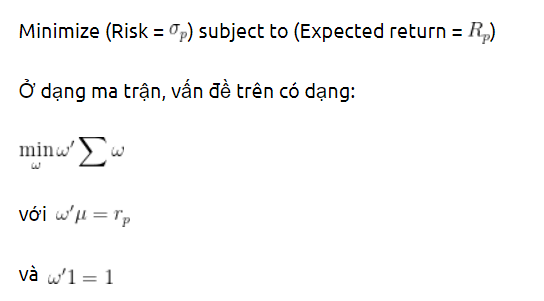
The optimization problem will be briefly presented through two situations:
At a given expected return, the investor will choose the portfolio with the lowest risk: